Research
Step 1: Understand
We learn your margins, priority products, customers, and constraints, and gather access to analytics, the store, and any past research or tests.
Output: Goals, the metrics that matter, and an access checklist

Conversion rate optimization for ecommerce
We find where visitors drop out of your store and why, prioritize the changes most likely to matter, build them, and measure what actually changed. You get a clear method and honest results, not promised lifts.
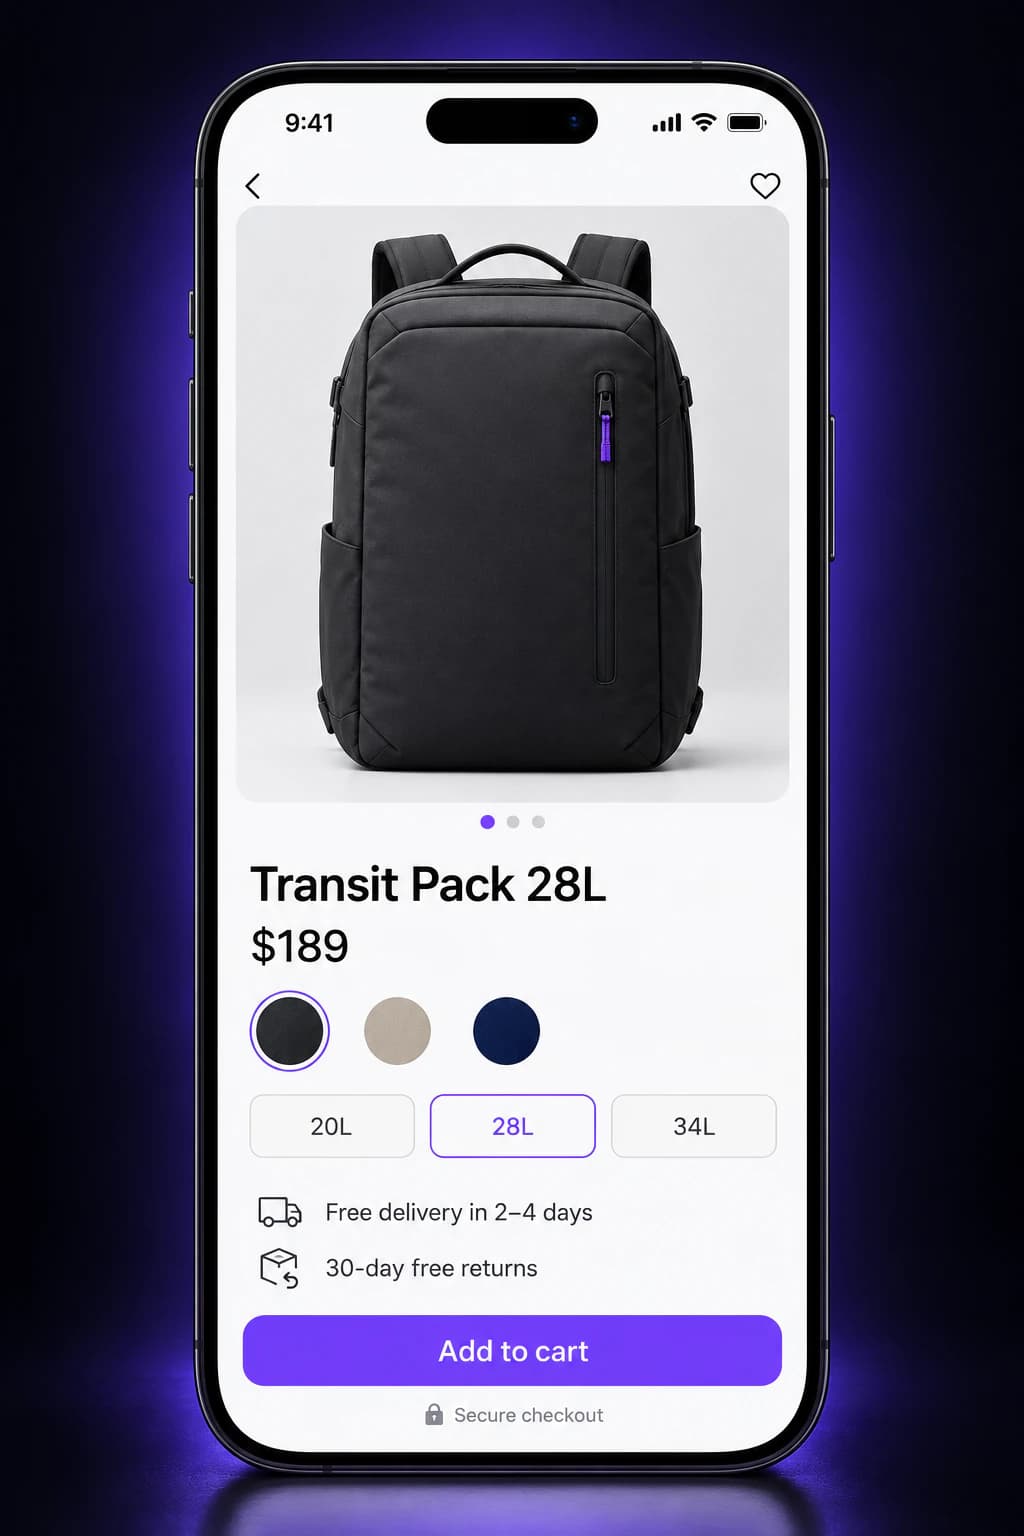
A conversion rate is an average, and averages hide where people actually stop. These are the patterns we look for at each stage. Treat them as questions to investigate, not verdicts: the same symptom can have a different cause on every store.
Arrive
Visitors from ads or email leave after a single page.
Worth checking
Browse
Shoppers search or filter, then leave without opening a product.
Worth checking
Decide
Product pages get plenty of views but few add-to-carts.
Worth checking
Commit
Carts are created, then abandoned once the total appears.
Worth checking
Complete
Shoppers start checkout but drop on one step or one device.
Worth checking
Analytics show where shoppers leave. Research explains why, and the why decides what to change.
Every research method sees part of the picture and has blind spots of its own. We combine several, choose them to fit your traffic and access, and are clear about what each one can and cannot tell us.

Diagnosis means looking closely at what shoppers actually see.
Shows: Where sessions drop out, broken down by device, channel, landing page, and template.
Falls short: Shows what happened, not why. It is only as reliable as the tracking behind it.
Shows: Whether product views, add-to-carts, checkout steps, and purchases are recorded once, with the right values.
Falls short: Fixing tracking can delay other work, but every later decision depends on it.
Shows: Hesitation, repeated taps, missed elements, and how far people scroll on key templates.
Falls short: Easy to over-read. We look for patterns across many sessions, not one memorable replay.
Shows: Friction measured against established ecommerce usability guidance and, in moderated sessions, where real shoppers get stuck and why.
Falls short: Shows that a problem exists, not how often it happens. Expert review produces hypotheses, not proof.
Shows: On-site surveys, reviews, and support tickets reveal doubts and objections in customers' own words.
Falls short: The people who answer surveys or write in are not every shopper.
Shows: Slow templates, layout shift, and broken states on the phones and browsers your customers use.
Falls short: A fast page still has to persuade. Speed is one input, not the whole answer.
One signal is a lead. When analytics, recordings, and customer feedback point at the same problem, it becomes a finding worth acting on.
The research decides which of these to work on first for your store. Each pairs a common shopper problem with what we deliver to address it.
Find your first priorityShoppers arrive from an ad or email and cannot tell at a glance that they are in the right place.
Deliverable: Message-matched landing sections for each campaign or channel, built and tracked.

We review: First screen, message match, load speed
The details needed to decide, such as size, materials, delivery cost, and returns, are scattered or missing.
Deliverable: A revised product template: gallery order, key details beside the price, and reviews where doubts arise.

We review: Gallery, decision details, review placement
On a phone, the first screen is often just the gallery image, and the buy button can sit several scrolls away.
Deliverable: Mobile-first layout changes: reachable purchase actions, lighter media, and forms tested on real devices.

We review: Thumb reach, sticky actions, media weight
Shipping costs, delivery dates, and the final total appear late and come as a surprise.
Deliverable: A cart that shows costs, free-shipping thresholds, and delivery expectations early, with a clear way back to shopping.
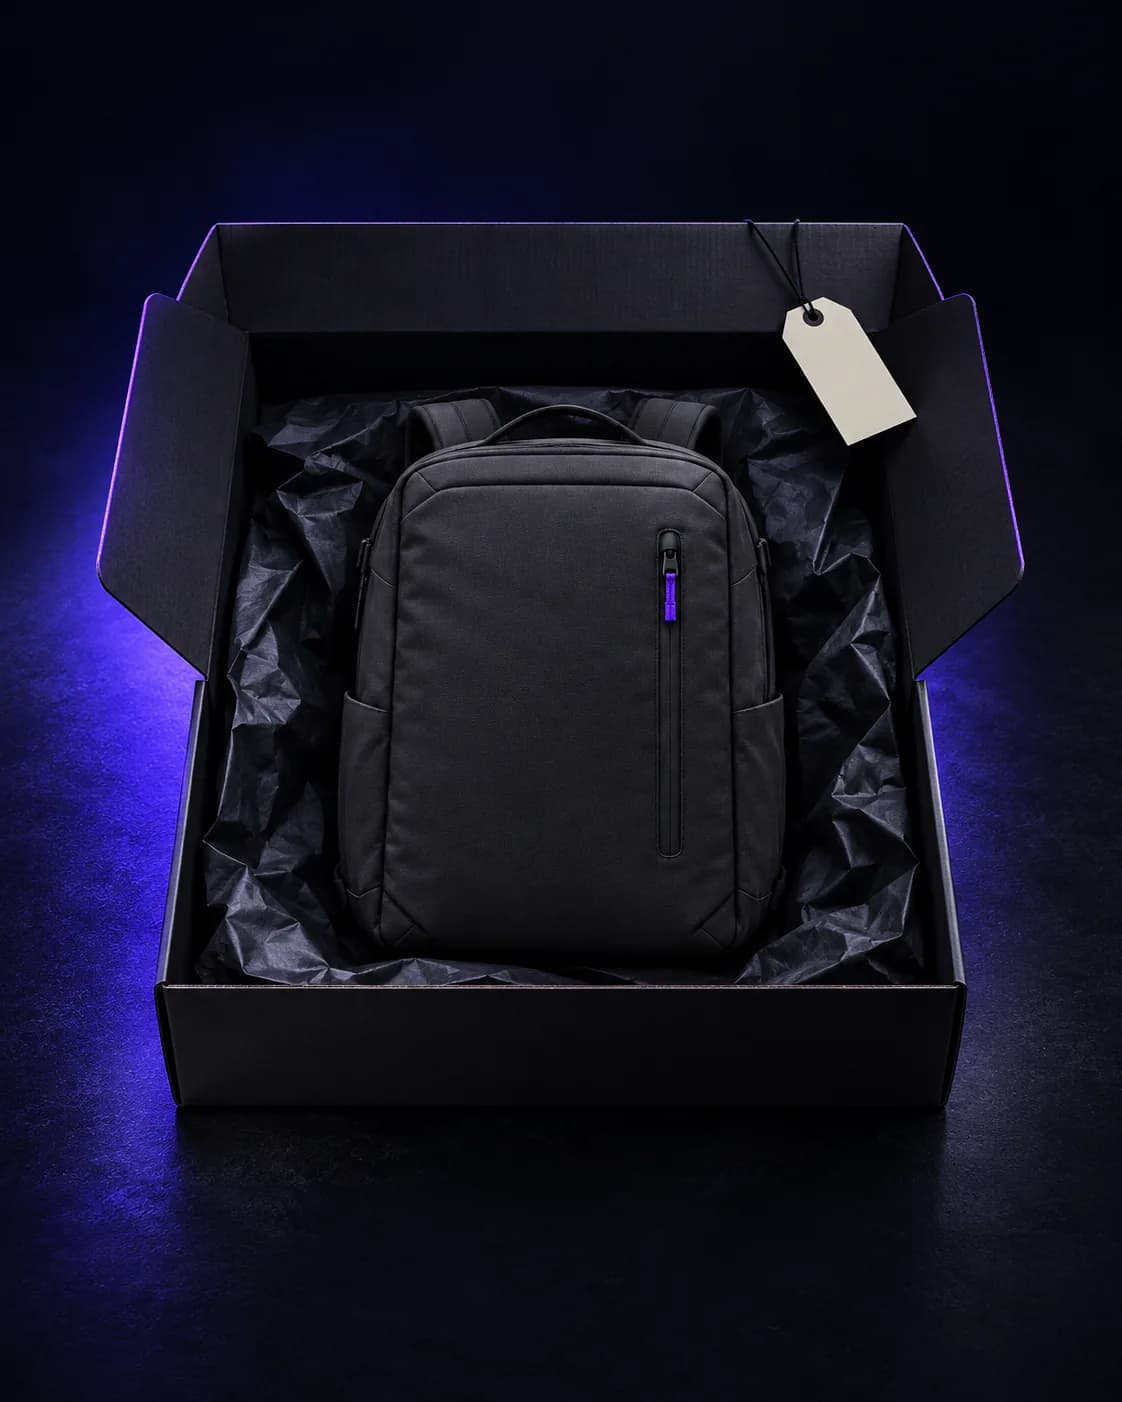
We review: Costs, thresholds, delivery dates
Form errors, missing payment methods, or a forced account step stop shoppers who have already decided to buy.
Deliverable: A checkout review against what your platform allows, with fixes to fields, payment options, and error messages.
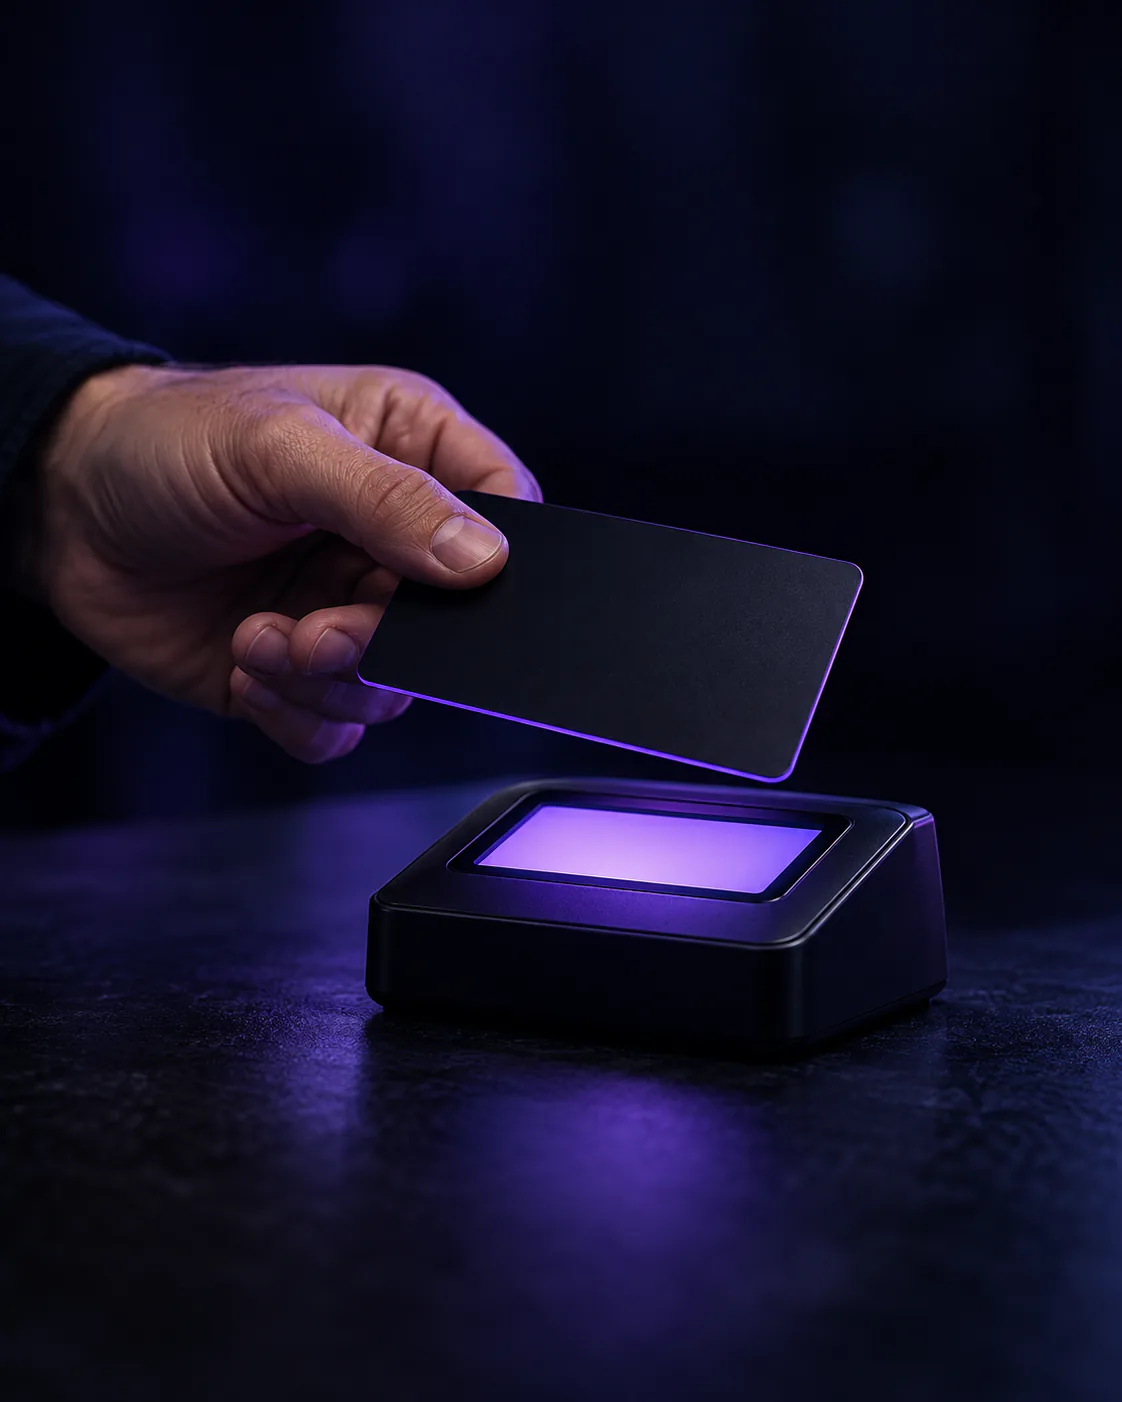
We review: Fields, payment options, error recovery
First-time shoppers cannot tell whether the store is reliable, or what happens if something goes wrong.
Deliverable: Returns, delivery, security, and support details placed beside the decisions they support, plus reviews in context.

We review: Returns, support, reviews in context
Six stages, repeated. Research, implementation, and validation stay separate, so you always know whether we are learning, building, or measuring.
We learn your margins, priority products, customers, and constraints, and gather access to analytics, the store, and any past research or tests.
Output: Goals, the metrics that matter, and an access checklist
We audit the tracking, review the funnel, watch sessions, walk through key templates on real devices, and collect customer feedback.
Output: Research findings, each with the evidence behind it
Each finding becomes a written hypothesis, scored on likely impact, confidence in the evidence, and the effort to build it.
Output: A ranked hypothesis backlog
We design the change, build it in your theme or codebase, add the tracking it needs, and QA it across devices before release.
Output: Shipped changes, or a test variant ready to launch
Where traffic allows, we run a controlled A/B test. Where it does not, we compare before and after with guardrail metrics, or validate with usability sessions.
Output: A result summary: what changed, how confident we are, what next
Every result, including neutral and negative ones, feeds the next round of research. Wins are rolled out; losing changes are rolled back.
Output: An updated backlog and the next priorities
Concrete outputs at every stage, grouped by what they are for, so research is never mistaken for proof and a shipped change is never mistaken for a win.
Scope your CRO program
What we found, and the evidence for it.
What is recorded correctly, what is missing or duplicated, and the fixes in priority order.
Each problem with its supporting evidence: data, recordings, customer comments, and screenshots.
Ranked ideas, each with the problem it addresses, the proposed change, and how it will be measured.
What we designed and built.
Annotated mobile and desktop designs for every change, ready for review before anything is built.
Theme or code changes released and checked across the devices and browsers your customers use.
The analytics events each change needs, set up and documented so results can be trusted.
What changed, and how sure we are.
The primary metric, guardrails, audience, and stopping rule, agreed before anything launches.
What changed, the likely size of the effect and its uncertainty, and the decision we recommend.
Every test and release in one place, including the ones that did not work, so lessons are not lost.
Every change starts as a written hypothesis with a measurement plan, agreed before anything is built. Here is an illustrative example. It shows the method, not a client result.
Discuss your first hypothesis
Illustrative, not a client result
When a page has enough traffic and conversions to detect a meaningful difference within a sensible time frame.
When traffic is too low to test. We compare like-for-like periods, watch guardrail metrics, and say plainly that the evidence is weaker.
When the main risk is that shoppers misunderstand the change. A handful of moderated sessions can show whether the design works as intended.
For clear defects, like a broken field or a missing payment method. They are fixed, released, and monitored, without a test to prove they were broken.
It depends on the state of your tracking, how much research is needed, and how quickly changes can be released. A focused audit covers the research and a prioritized backlog. An ongoing program then runs in cycles of research, implementation, and validation, and each A/B test runs until it reaches the sample size agreed before launch, which depends on your traffic. We give you a timeline once we have seen your data.
There is no single threshold. What matters is the number of conversions on the page being tested, its current conversion rate, the smallest change worth detecting, and how long you can wait for an answer. We work this out for each test before launch. When traffic is too low, we validate in other ways, such as before-and-after comparisons with guardrail metrics or usability sessions, and are clear that the evidence is weaker.
No. Clear defects, such as a broken form field or a missing payment method, are fixed and monitored. A test is worth running when there is real uncertainty about a change, enough traffic to get an answer, and a decision that depends on it.
Usually access to your analytics (for example GA4), your ecommerce platform's reports, and your store admin or codebase, plus any session recording, survey, review, or support tools you already use. Results from past tests or research help too. We confirm the exact list after the first conversation.
Both. We design and build changes in your theme or codebase, set up the analytics events and experiments they need, and QA every release. If your team prefers to build, we provide designs, specifications, and test plans, and review the work before it goes live. How much of the checkout can change depends on your platform and plan.
Each change has a primary metric, such as add-to-cart rate or checkout completion, and guardrail metrics that must not get worse, all agreed before launch. We report results with their uncertainty and look at revenue per visitor alongside conversion rate, so a change that converts more but earns less is not counted as a win.
No. Some changes improve results, some make no measurable difference, and some are rolled back. What we commit to is a sound method, careful implementation, and an honest account of what changed.
We work most often with Shopify and Shopify Plus stores, and also with other ecommerce platforms and custom-built storefronts. Platform limits, especially around checkout, shape what we recommend.
Tell us about your store and the question you want answered. Here is what happens after you get in touch.
Your store URL, what you sell, where you suspect shoppers drop out, and the tools you already use.
We read what you send and work out what we would need access to in order to investigate properly.
Usually a focused CRO audit. If tracking needs fixing first, or CRO is not the right place to start, we will tell you.

Start your CRO enquiry
Share the bottleneck, the timing, and what a useful outcome looks like. We review the context and reply with a useful next step.
Prefer email? hello@eaglexor.com